Program Totals
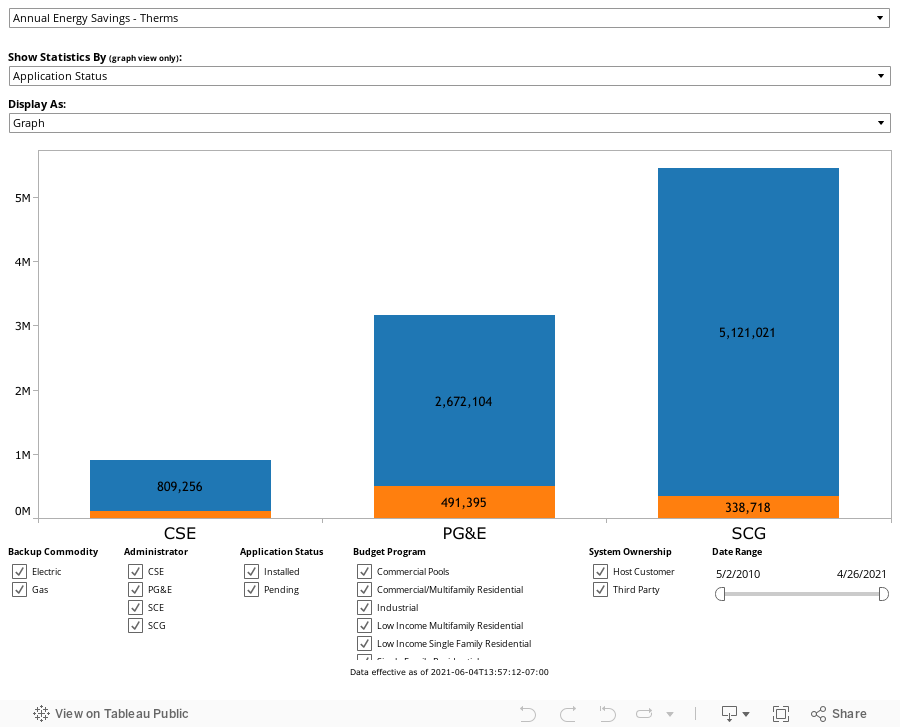
This figure displays aggregated solar thermal project data for each Program Administrator (PG&E, SCE, SCG, and CSE) by incentive paid, energy savings, and number of applications. The figure can be further refined to display information by application status, host customer sector, and date. To see how these statistics have changed over time, choose the "Monthly, Quarterly, and Annual Statistics" figure from the navigation menu on the left side of the page.
Installed applications are those that have been paid or are in the process of being paid. All other applications that have not been Canceled are considered Pending. For any questions about interacting with the graphs and tables, please consult the FAQs.